In order to check the health of our plants (nutritional status), we often wonder, which is better to do: leaf diagnosis or soil analysis?
Do we need both, or do we not?
Let’s start by looking at what is one and what is the other…
Soil analysis: It is the examination of the soil where it shows us the physical characteristics of the soil, such as ph, organic matter content, soil nutrients, water holding capacity, moisture and others.
It basically shows us what nutritients may be available to our plants and gives “instructions” in some way or guidelines for fertilization.
Leaf Diagnosis (Leaf Analysis): It is the direct measurement of the nutritional status of the plant.
What is leaf diagnosis / foliar diagnosis?
When we use the leaves of a plant for analysis to find the concentrations of mineral nutrients during the growing season. With foliar diagnostics (also known as leaf diagnosis) we can determine the existing nutrient status but also prevent nutrient deficiencies. It is also possible to use the fruits or stems but as a rule it is the leaves. This is because it is in the leaves that basic functions such as photosynthesis and metabolism take place and also because more than 50% of all nutrients are concentrated in the leaves. The nutrient content of the leaves is directly related to the growth of the plant and is therefore used as an indicator of nutrient status.
Leaves are collected from both healthy and diseased plants in order to compare their nutrient content. This use of foliar diagnostics is an effective way of diagnosing mineral nutrition disorders. Foliar diagnostics therefore makes it possible to ascertain the degree of nutrient supply of a crop and its expected response to the application of one or more of these nutrients. This result is of particular practical value because it is directly related to the type of fertiliser required by the crop to meet its actual needs. It is not possible to determine the quantity and form of fertilisers by this method, but the value and effectiveness of the method cannot be underestimated.
The basic question that concerns every grower is which nutrients are likely to limit the growth of the plants he is growing at any given time. The answer given to this question on the basis of foliar diagnostic data is the most reliable answer that can be obtained today.
The further use of this data to improve the mineral nutrition of the crop depends on other factors, especially soil properties. For this reason, foliar diagnostics is most effective and utilized when combined with soil analyses, which provide the necessary information on the etiology of nutrient deficiencies and the effective application of the nutrients a crop needs.
When can we perform leaf diagnostics on our crops
Almond: the best time to sample is in July, within the first ten days. The leaves are sampled from thin branches.
Apricot: takes place in the months of June-July. Leaves are taken from shoots that have no fruit. We need 8-10 leaves/tree and we take them every 30-50 trees. Our sample in total should have 150-200 leaves.
Olive: about 6 weeks after full flowering, e.g. if we have flowering in early May we will take the sample around 15 June. Of course we make sure our trees have no problems, either disease or insect, we sample every 5 or 10 trees, 4-8 leaves with stems/tree are good and then put them in nylon bags. If you are unable to take them to the lab the same day, put them in the refrigerator and at a temperature of 3-5 degrees Celsius, but not in the freezer.
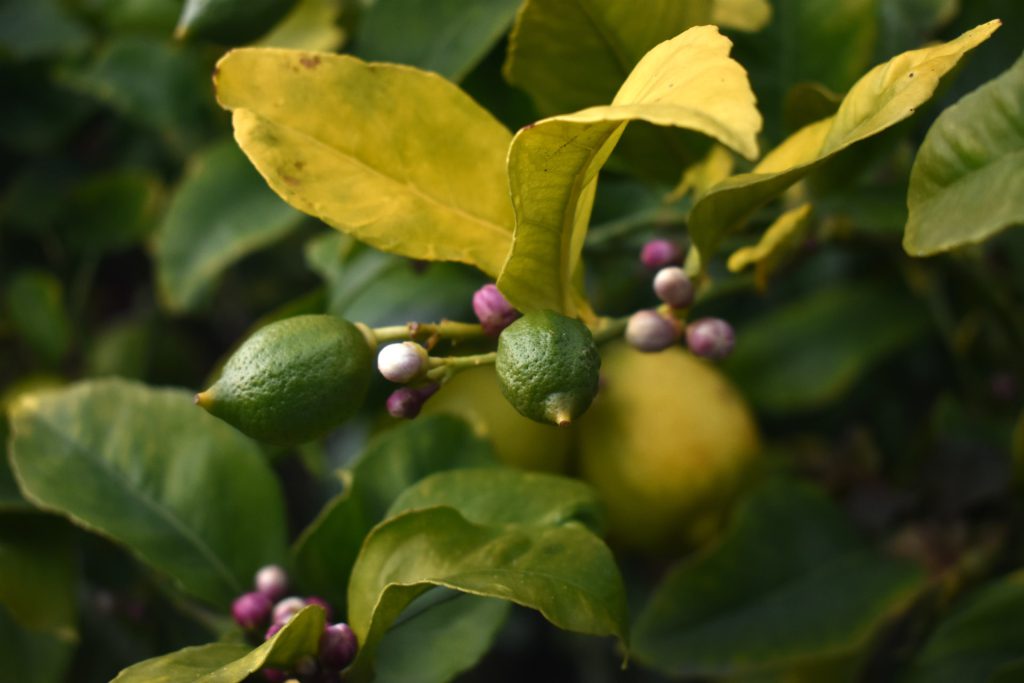
Citrus fruit (orange, lemon, tangerine, kumquat, sour orange): for citrus fruit, leaf-testing is done from August to November, but it is best done in the second half of September. Samples are taken from 5 or 10 trees, the leaves should have their stems (the stalk that connects the leaf to the stem), placed in nylon bags and refrigerated (as for olives).
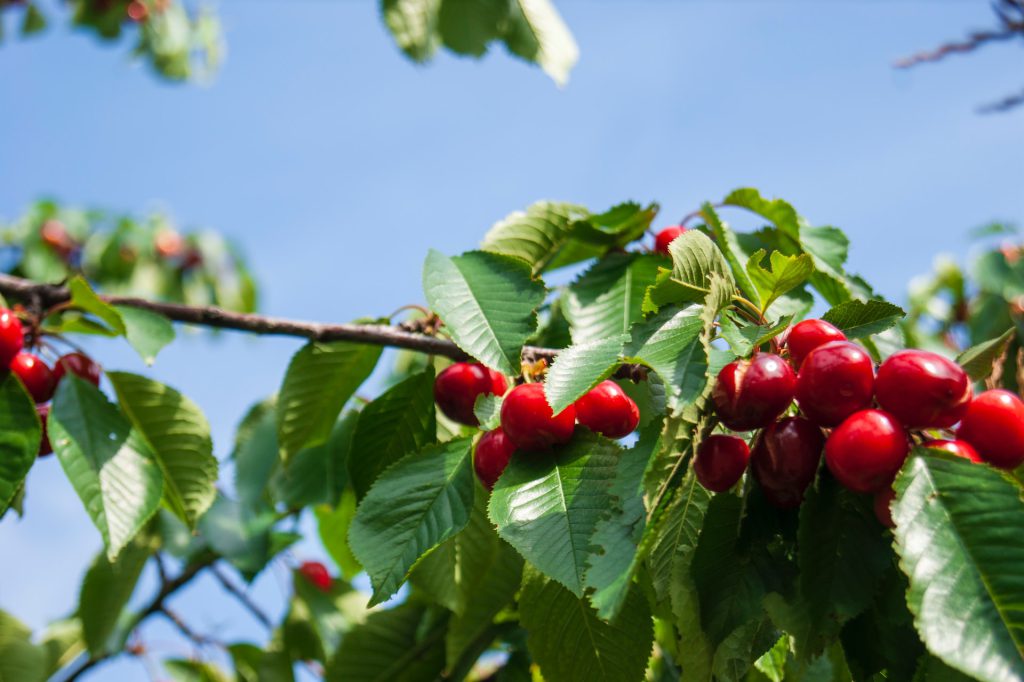
Cherry, Sour Cherry: the leaves are sampled when the fruit is harvested, from the base of one year’s worth of shoots.
Apple, Pear: sample after full flowering, about 8-12 weeks, from various sides of the tree, we take the leaves along with the stems. For those of you with a garden or field, make sure the leaves are from trees of the same age, variety and rootstock. Our sample is good when we have collected 40-100 leaves, place them in paper bags and the known… refrigerator.
Peach: when we have an early variety we sample our leaves before fruit collection, and if we have a late variety we take our sample around 8-12 weeks before full bloom. In both cases, we cut the leaves from either the base or the middle of the annual shoots that bear fruit.
Peanut: the sample is usually taken between 20 July and the beginning of August. We take 4 composite (when divided into two or more smaller leaves, e.g. rose, clover, bean) leaves from each tree and from a height of 1,2 to 1,8 m circumferentially of the tree and store them in nylon bags until we can take them to the laboratory as soon as possible.
Carrot: analysis shall be carried out on the stems of new leaves or on the lamina of older leaves.
Watermelon: take the sample at the stage of development of the first fruit and take the 6th leaf (including the stem) from the top.
Cabbage: the appropriate period is as soon as the heads start to form, take the middle leaves of the wrapper.
Asparagus: leafing is done at the end of June, when the vegetation is fully developed. Take 30 cm long branch leaves (they have a spidery surface and help transpiration) from developed shoots of male plants.
Tomato, Cucumber: suitable intervals for leaf diagnosis: 8 weeks after transplanting, 13 and 21 weeks after. Take leaves, from mature ones, usually 40 to 60 from the top.
Beans: the sample is taken at the fruiting stage and analysis is done on the stem of the 4th leaf from the apex.
Kiwi: from August to early September, the sample is taken from a stem with at least 8 leaves after the fruit and the 4th leaf is selected.
Vine: 3-5 leaves are taken per 10-15 stems, at the beginning of flowering or at the end of flowering or at the beginning of budding or at maturity.
Cotton: for those who also have, before or at flowering the youngest but fully mature leaves. A suitable sample is 30-40 leaves.
Changes in the concentrations of mineral nutrients in the leaves during the growing season
During the vegetative period in plants, changes in nutrient levels are observed in plants, which are related to the stage of development of our plants and can be monitored by repeated sampling. These changes are due to the mobility of nutrients in the different parts of the plant. Depending on this mobility, the inorganic nutrients can be divided into:
- (a) mobile which are nitrogen (N), phosphorus (P), potassium (K), magnesium (Mg), sodium (Na), sulphur (S) and chlorine (Cl)
- (b) medium mobility: iron (Fe), manganese (Mn), zinc (Zn), copper (Cu) and molybdenum (Mo); and
- (c) Dyskinetic: calcium (Ca) and boron (B)
The mobile elements can be transferred from one organ to another, while the mobile elements are difficult or impossible to transfer.
The amount of a nutrient determined in a particular part (leaf tissue) at a particular time can be described as follows:
Concentration (accumulation) of an element = input – output + production – consumption
The tissue does not produce but also does not consume nutrients, therefore, the accumulation of the nutrient identified is in fact the result of the difference between the quantities that entered and exited.
On the basis of the above relationship, the following cases can be distinguished:
- The amount of nutrient entering the leaf is greater than the amount leaving, in which case the amount of nutrient in the leaf increases (positive accumulation). This can be observed in a young leaf.
- The amount of nutrient entering the leaf is equal to the amount leaving, in which case the amount of nutrient in the leaf is maintained (zero accumulation). This is what we observe in a mature leaf.
- The amount of nutrient entering the leaf is less than the amount leaving, so the amount of nutrient in the leaf decreases (negative accumulation). This can be observed in an aged leaf.
The disturbances in the nutrient status of the plant
Let’s start by looking at some definitions of information and knowledge.
- Nutrient deficiency: this is a pathological condition resulting from an insufficient supply of nutrients to the plant.
- Toxicity: this is the pathological condition resulting from an over-supply of nutrients to the plant. So, as you will understand, by applying excessive amounts, because we think we are helping, we are doing the opposite.
- Simple food deficiency: due to a deficiency of a nutrient.
- Complex food deficiency: deficiency due to two or more nutrients.
- Visible food deficiency: when we see symptoms in different parts of the plant.
- Hidden nutrient deficiency: there is a nutrient deficiency without visible symptoms. This means one of two things: either the deficiency is not very severe or the deficiency is in an early stage.
- Actual trophic deficiency: due to an actual deficiency or even a perfect deficiency of the respective nutrient in the soil.
- Apparent deficiency: the element is present in the soil in quantitative terms but cannot be utilised by plants either because it is bound or because it is located at great depth.
How can we diagnose nutrient deficiency?
Nutrient deficiency generally does not cause very characteristic symptoms and it would therefore be better to use more than one diagnostic method each time, depending of course on the plant species. The methods are as follows:
1. Macroscopic method
In this case, our plants suffer from a relatively large deficiency of a nutrient and show visible symptoms not only in the leaves but also in other organs of the plant. These symptoms are varied and may include blanching, spots, necrosis of leaves, branches or even the whole plant. It is considered a very useful method because observing the symptoms speeds up the final diagnosis.
2. Comparative method
The symptoms are compared with colour photographs of artificially induced trophic levels.
3. Leaf diagnostic method
Analysed above.
4. Method of diagnostic nutrient administration
This method is used to test the response of diseased plants to separate applications of nutrients for which food deficiency is suspected. The disappearance of symptoms and the general improvement in the condition of the plants following the application of one of these elements reveals the specific food deficiency. The application of nutrients for diagnostic purposes to plants shall be carried out by one of the following methods: addition to the soil, foliar spraying, dipping of stems and foliar application.
5. Method of inoculation
By inoculation it is possible to establish whether a disease is due to a foodborne or a virus. Tissue from the affected plant is inoculated into a healthy subject. If the disease is transmitted to it then it is a virus, otherwise it is probably due to a foodborne disease.
Characteristic symptoms of deficiencies
Depending on the location of our symptoms on the plant, deficiencies can be divided into two categories:
1) When the symptoms are first observed in the leaves at the base of the plant and progress upwards over time, even reaching the leaves at the top, then we are talking about nitrogen, phosphorus, potassium and magnesium trophobia. When we see this, the young leaves of the plant take up the necessary elements from the lower leaves, resulting first in the appearance of symptoms and then in the drying of these base leaves. If the cause is not treated, these symptoms progress to the leaves above.
2) In the second category are deficiencies whose symptoms are first seen in the top leaves and then progress down ward. This category includes nutrient deficiencies caused by deficiencies of calcium, boron, manganese, copper and iron.
We have referred to nutrient deficiencies in previous articles, but these were specific to the crop in question. Here we will look at some general symptoms that can be seen depending on the deficiency we have… And here we go:
Nitrogen deficiency, phosphorus deficiency
1. When the lower or older parts of the plant show the symptoms first or most severely, and the symptoms generalize to the entire plant, then we have nitrogen-phosphorus deficiency.
Nitrogen deficiency
Our leaves are initially light green in color, which then turns yellowish green or yellow with necrosis on the lower leaves. Our shoots have little growth, are thin and the fruits are small in size.
Phosphorus deficiency
There is a slow growth rate and we have metachromosis on the stems and also on the lower surface of the leaves.

Figure 1: Nitrogen deficiency in a hemp plant.

Figure 2. Phosphorus deficiency in corn plant.

Figure 3. Phosphorus deficiency in a sunflower plant.
Potassium deficiency, magnesium deficiency, molybdenum deficiency
When the symptoms are mainly concentrated in the lower, older leaves, then we are dealing with potassium-magnesium-molybdenum deficiencies.
Potassium deficiency
A characteristic feature of this deficiency is necrotic or chlorotic spots, without a specific shape, on the periphery of the leaf. Later, the leaves turn yellow, the chlorosis extends to the nerves and the lower leaves fall off. The shoots of the plant become weak but at the same time tough and the fruits show uneven ripening.
Magnesium deficiency
Initially there is peripheral chlorosis between the main leaf nerves, which is later transferred. Perhaps, without being certain, metachromism occurs instead of chlorosis and bear in mind that very rarely do we have necrosis of the leaves in magnesium trophobia.
Molybdenum deficiency
Main features: chlorosis, necrosis and curling of the leaves. Young leaves are green at first but develop spots when fully developed.

Figure 4. Potassium deficiency in corn.

Figure 5. Magnesium deficiency at early stage.

Figure 6. Magnesium deficiency at an advanced stage, in the same plant as the previous picture.

Figure 7. In the above picture, we have manganese deficiency on the right and magnesium deficiency on the left.

Figure 8. On the left, a tomato plant without molybdenum deficiency, while on the right, a plant with deficiency.
An article by Agronomist Sophia Papazoglou
Agricultural Engineer – MSc Environmental Management
Part 2 of the article
The second part of the article can be found at “The diagnosis of the nutritional status of the plant – Part 2/2“.
Tags: DEFICIENCIES • DEFICIENCY • DIAGNOSIS • FOLIAR DIAGNOSIS • NUTRIENTS • SOFIA PAPAZOGLOU AGRONOMIST • SYMPTOMS